My research essay evaluated the changes of public perception due to television and Law & Order: Special Victims Unit’s positive techniques of getting that done. It was difficult to do at first because theres a lot of information I could not combine together to make one neat infographic, but I got it done. The title for my infographic is “True Crime Television and its Influence on Cultural Perceptions.” It was placed into bold white letters with a soft purple background. There are two subheadings throughout this infographic. They are labeled ” Law and Order Special Victims Unit Rips Stories from the Headlines and Media Effects on Romantic Views.”
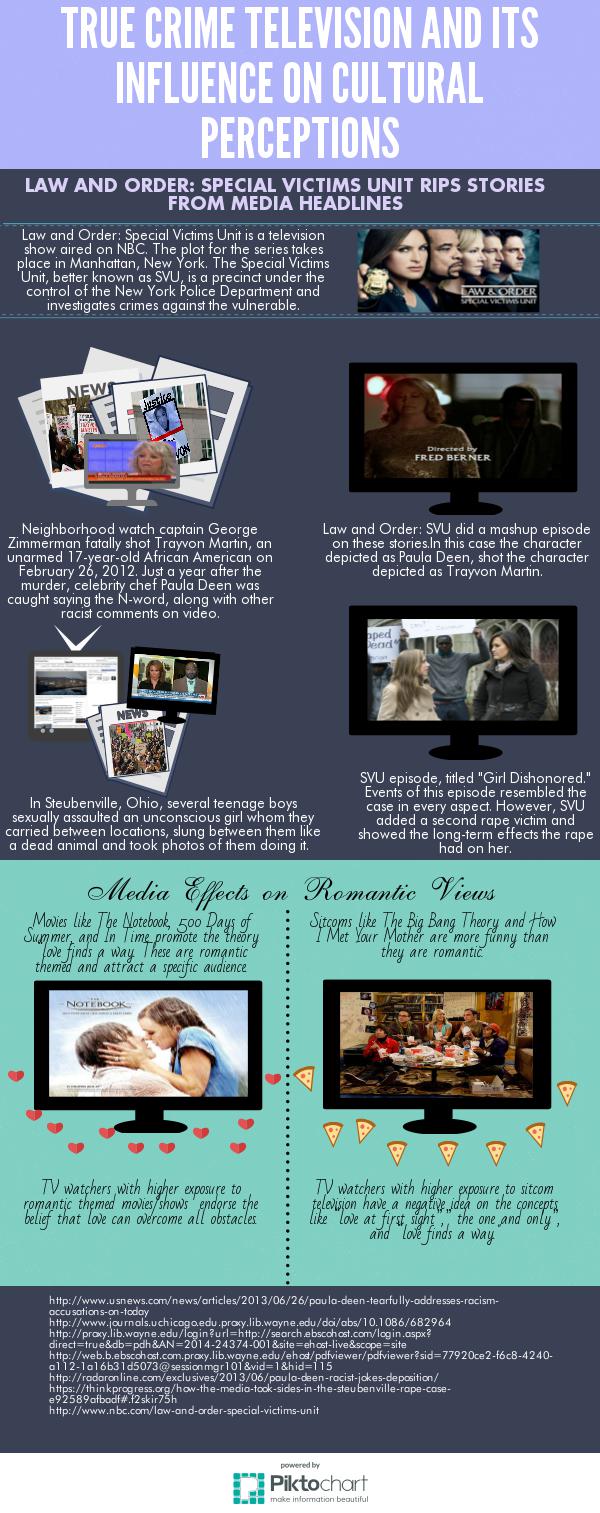
The first section describes Law and Order: SVU and what its goal is in television. Next In order to address this correctly, I started off with portraying how Law and Order: SVU rips stories from the headlines. I showed two sides to this block, I allowed for a side that shows real life news and the events that SVU did episodes off of. On the other side, I took pictures from the episodes that were depicted from these real life situations and put them into a TV icon. So far, the infographic has an even set up. Theres two icons going across. This infographic is meant to be read from left to right. I tried to be as repetitive as possible so I can develop a pattern. The two episodes I chose to show were both placed into TVs and the two real life photos of the actual crimes were in newspapers and TVs. Each picture had a brief description under it. The background color for this block is a tinted purple.
The second block of my infographic focused on how media genres have an effect on audiences views on media. The layout for this part is very similar to the SVU section. It has an even layout with two pictures on each side. The left side showed how viewers of romantic themed shows/movies are drawn to ideas similar to the movies they watch. On the right side I did the same thing, but instead of showing the relationship between romantic themed television and views on love, I showed the effects sitcoms and the perceptions they inflict on their viewers. This block is meant to be read up to down. The background of this block is a very light tinted blue.
I changed the colors of each block to show a transition from one block to other. Also, I used the TV icon several times throughout the infographic to emphasize on the importance of TV and its relation to perceptions. The font for the two blocks differed. The “Law and Order Special Victims Unit Rips Stories from the Headlines” block had a serious typed font. None of the letters were curved because I wanted to build credibility for this block because it discusses serious topics. For the second block, however, I used a font with curled letters because it talks about romance. I made sure the fonts for these blocks were correlated to what was discussed in them. The font size was easy on the eyes and the colors of the font were chosen based off the background. The easier it is to read the infographic, the better.
In my research essay, I discussed the research on love first and then went on to talk about Law and Order: SVU and how it rips headlines from the news. However I did the opposite on my infographic. I wanted to show how SVU rips stories from the headlines first and allow for viewers to make conclusions about my findings after they read the second block. This way they’ll understand the effectiveness of basing TV stories off of current events and why the show does this. The second block shows proof that perceptions are changed by TV. Viewers can then make connections about why Law and Order: SVU rips stories from headlines, which is to change their audiences views on these sensitive topics.
I used all of my sources from research except for one. I didn’t use the Public Perception of Scientists, and What We Can Do about It by Donna Nelson article in my infographic. I wanted to make my point very clear by using two sections only. There isn’t a correct place to add this article. If I add a lot of examples that don’t have a strong connection, my point can be lost in the infographic. Using only the “Law and Order Special Victims Unit Rips Stories from the headlines and Media Effects on Romantic Views” subtitles make my infographic clear and organized. I cited one picture from my infographic, the rest of the images were copyright free or labeled for noncommercial reuse.
This project made me a better visual learner. I’ve had so much exposure to written essays and this is the first visual and creative project I’ve been asked to do this semester. This helped me grow as a rhetor because it showed me the technicalities of getting a point across. The way people are exposed to a piece plays a big role on how they take in the information from the piece.
